Keeping up with academic research trends is now easier with these 7 AI-powered tools. They analyze vast datasets, track citations, and uncover emerging topics in minutes, saving researchers weeks of manual effort. Here’s a quick look at what each tool offers:
- Scite.ai: Provides Smart Citations to assess whether studies support or refute findings.
- Dimensions: Tracks publications, funding, and collaborations with predictive analytics.
- Semantic Scholar: Focuses on citation context and visualizes research trends.
- Connected Papers: Creates visual maps to explore relationships between studies.
- Research Rabbit: Offers real-time literature maps for trend analysis.
- Lens.org: Combines scholarly and patent data for innovation tracking.
- Publish or Perish: Calculates citation metrics like h-index and g-index.
Quick Comparison
| Tool | Key Features | Pricing |
|---|---|---|
| Scite.ai | Smart Citations, AI Assistant, Journal Dashboards | Custom Pricing |
| Dimensions | Research Mapper, Predictive Analytics | Free to Enterprise |
| Semantic Scholar | Smart Citation Analysis, Trend Visualization | Free |
| Connected Papers | Visual Citation Maps, Prior Works Analysis | Freemium |
| Research Rabbit | Real-Time Literature Maps | Freemium |
| Lens.org | Patent + Scholarly Data, Open Access | Free |
| Publish or Perish | Citation Metrics, Trend Visualization | Free |
These tools simplify research by offering trend insights, collaboration opportunities, and real-time updates. Whether you’re a student, academic, or institution, combining these platforms can enhance your research workflow.
AI Just Made Literature Review a Piece of Cake
1. Scite.ai
Scite.ai reshapes how researchers evaluate studies with its Smart Citations database, which examines over 1.2 billion citations from 200 million sources. Using AI, it provides context for citations, helping users quickly see if later studies support or challenge earlier findings. This approach makes literature reviews faster and helps identify research trends with ease.
Here’s what Scite.ai offers:
- Smart Citations Database: Delivers context for citations by analyzing full-text articles, showing whether newer research supports or contradicts the original work.
- Journal Dashboards: Pre-built analytics that highlight publication trends, top authors, and Scite Index rankings.
- AI Assistant: A tool powered by a large language model and the Smart Citations database, designed to minimize errors in research.
Scite.ai has gained traction among over 969,000 students, researchers, and professionals. Its accolades include the ALPSP Award for Innovation in Publishing and an NSF Phase 1 SBIR Grant.
"The feature that classifies papers on whether they find supporting or contrasting evidence for a particular publication saves so much time. It has become indispensable to me when writing papers and finding related work to cite and read."
– Emir Efendić, Ph.D, Maastricht University
"Being able to assess what is disputed or affirmed in the literature is how the scientific process is supposed to work, and scite helps me do this more efficiently."
– Kathleen C McCormick, Ph.D Student, Cornell
With these tools, Scite.ai has become a go-to resource for staying on top of new research. Contact Scite.ai for tailored pricing options for individuals, institutions, or businesses.
2. Dimensions
Dimensions is an analytics platform that leverages AI and a massive dataset to monitor and analyze research trends. It examines over 128 million publications, grants, patents, clinical trials, and policy documents, offering a complete view of the research landscape.
Here are some of its standout tools for analyzing trends:
- Research Mapper: A tool powered by AI that visually maps relationships between topics, authors, and institutions.
- Analytics Dashboard: A customizable interface that showcases metrics like publication counts, citation trends, and funding data across various fields.
- Predictive Analytics: Machine learning algorithms that pinpoint emerging research topics and areas of potential growth by studying publication patterns.
These features simplify the process of identifying trends across different research areas. Using natural language processing, the platform classifies research into over 22 fields and thousands of subfields, making it easier to track developments in specific domains without manual tagging.
The analytics suite includes:
- Publication Trends: Monitors research output and its impact over time.
- Funding Analysis: Tracks how grants are distributed and where investments are being made.
- Impact Tracking: Measures research influence through citations and other metrics.
- Collaboration Networks: Maps partnerships between researchers and institutions.
Subscription Options
Dimensions offers three subscription levels to cater to different needs:
| Subscription Level | Features | Access Type |
|---|---|---|
| Free | Basic publication search and analytics | Individual |
| Plus | Advanced analytics, API access, exports | Individual/Team |
| Enterprise | Custom reporting, unlimited API calls, full support | Organization-wide |
This platform is particularly useful for research institutions and funding bodies, as its machine learning capabilities improve search accuracy and make it easier to identify new trends.
Dimensions processes around 200,000 new outputs weekly, updating its database daily. The platform’s AI continuously analyzes this influx of data to highlight shifting priorities and uncover emerging fields of study.
3. Semantic Scholar
Semantic Scholar stands out among AI tools for research trend analysis with its focus on detailed citation insights and interactive visual tools. It combines citation context with dynamic visualizations to help users navigate complex research landscapes.
Key Features
Smart Citation Analysis
Semantic Scholar employs AI to understand the purpose behind citations. It can differentiate between supportive, contradictory, or methodological references, offering a deeper look into how topics evolve over time.
Research Trend Visualization
The platform provides interactive tools like graphs, heat maps, and network diagrams. These visuals showcase trends in publications, geographic research activity, and institutional collaborations, making it easier to grasp large-scale patterns.
Semantic Scholar regularly updates its database and extracts key concepts, enabling users to quickly spot new research directions.
Enhanced Search Precision
Semantic Scholar improves search accuracy with advanced AI techniques, including:
- Topic Modeling: Groups related concepts to uncover new subfields of study.
- Author Analytics: Tracks the influence of researchers and maps collaboration networks.
- Impact Tracking: Goes beyond traditional citation counts to measure broader research influence.
Data Integration
The platform pulls data from multiple scholarly repositories, ensuring users have access to the latest trends and insights.
Used by research institutions, funding bodies, and individual scholars, Semantic Scholar provides fast and efficient tools to stay on top of emerging trends. Its focus on citation context and visualization highlights how AI is reshaping research analysis.
sbb-itb-58f115e
4. Connected Papers
Connected Papers takes advantage of AI to create visual maps that help researchers explore and understand trends in academic studies. By generating interactive visuals, it uncovers links between publications and tracks how research topics evolve over time.
Visual Research Navigation
The Graph View is at the heart of Connected Papers. It displays research papers as nodes in a network, where the size of each node represents its citation impact, and the distance between nodes shows how conceptually similar they are. This makes it easy to spot key studies, emerging research clusters, and how ideas spread.
Discovery Tools
The Prior Works Analysis feature identifies influential papers that have shaped the foundation of current research. It does this by analyzing citation patterns and semantic relationships.
Data Sources
The platform pulls its data from a variety of sources, including arXiv preprints, PubMed Central, peer-reviewed journals, and conference proceedings.
How Researchers Use It
Connected Papers is particularly useful for:
- Literature Reviews: Creating visual citation maps to identify important studies.
- Research Planning: Spotting promising areas of study by analyzing publication trends.
- Collaboration Discovery: Finding potential collaborators through network insights.
Pricing and Access
Connected Papers operates on a freemium model. Basic visualizations are free, while more advanced analytics are available through a premium plan. Institutions can also purchase licenses. The platform is regularly updated, ensuring researchers have access to the latest data. Its AI-driven, visual-first approach makes it a helpful tool for navigating academic research.
5. Research Rabbit
Research Rabbit creates interactive literature maps that highlight connections between research topics, articles, and authors. These dynamic maps make it easier to spot new trends and potential collaborations quickly. Unlike static tools, Research Rabbit provides real-time updates on research developments, making it a great companion to platforms like Connected Papers.
The platform’s user-friendly design makes it accessible to both experienced researchers and students, simplifying the process of finding relevant literature. It operates on a freemium model – offering essential features for free, while premium plans unlock advanced analytics and visualization tools.
If you’re into visual mapping, the next tool takes your analysis to the next level.
6. Lens.org
Lens.org is a research platform that combines scholarly publications and patent data to uncover research trends and innovation patterns. It offers access to over 200 million scholarly records from sources like Microsoft Academic, PubMed, and Crossref, enriched with data from OpenAlex and UnPaywall.
The platform’s MetaRecord (MeR) and LensID systems connect various research elements, making it easier to identify trends and encourage collaboration across fields. This dual approach gives users a broader understanding of research and its impact.
Key search tools include:
- Boolean operators for precise queries
- Structured search filters
- Biological sequence analysis tools
- Classification-based filtering
- Dynamic sorting options
These tools help researchers track trends across disciplines with precision and flexibility.
Lens.org also allows users to analyze citations, create and share collections of patents and academic portfolios, and use visual analytics to identify trends effectively.
Dr. Paul Oldham from One World Analytics highlights the platform’s strengths:
"The Lens is becoming the go-to database to combine analysis of the scientific and patent literature to inform international policy debates on trends in science and technology… For those of us who care about transparent and robust methods to inform decision making the open nature of the Lens is a huge plus."
- Dr. Paul Oldham, One World Analytics & Responsible Research and Innovation Group, Manchester Institute of Innovation Research (MIoIR)
Lens.org is completely free to use. As explained by The Lens team:
"With us, everyone can access and use the website at no cost. We don’t do ‘Freemium’. Everybody uses Lens for free. We think the ability for anyone to create new value should not be constrained by access to critical knowledge."
Joshua Rodgers from KPMG also emphasizes the platform’s analytics capabilities:
"The customizable analytics are unrivaled and provide fast and dynamic access to key insights."
- Joshua Rodgers, KPMG Associate Director
For life sciences researchers, Lens.org offers tools to explore over 508 million biological sequences disclosed in patents, making it a powerful resource for biological and medical research.
7. Publish or Perish
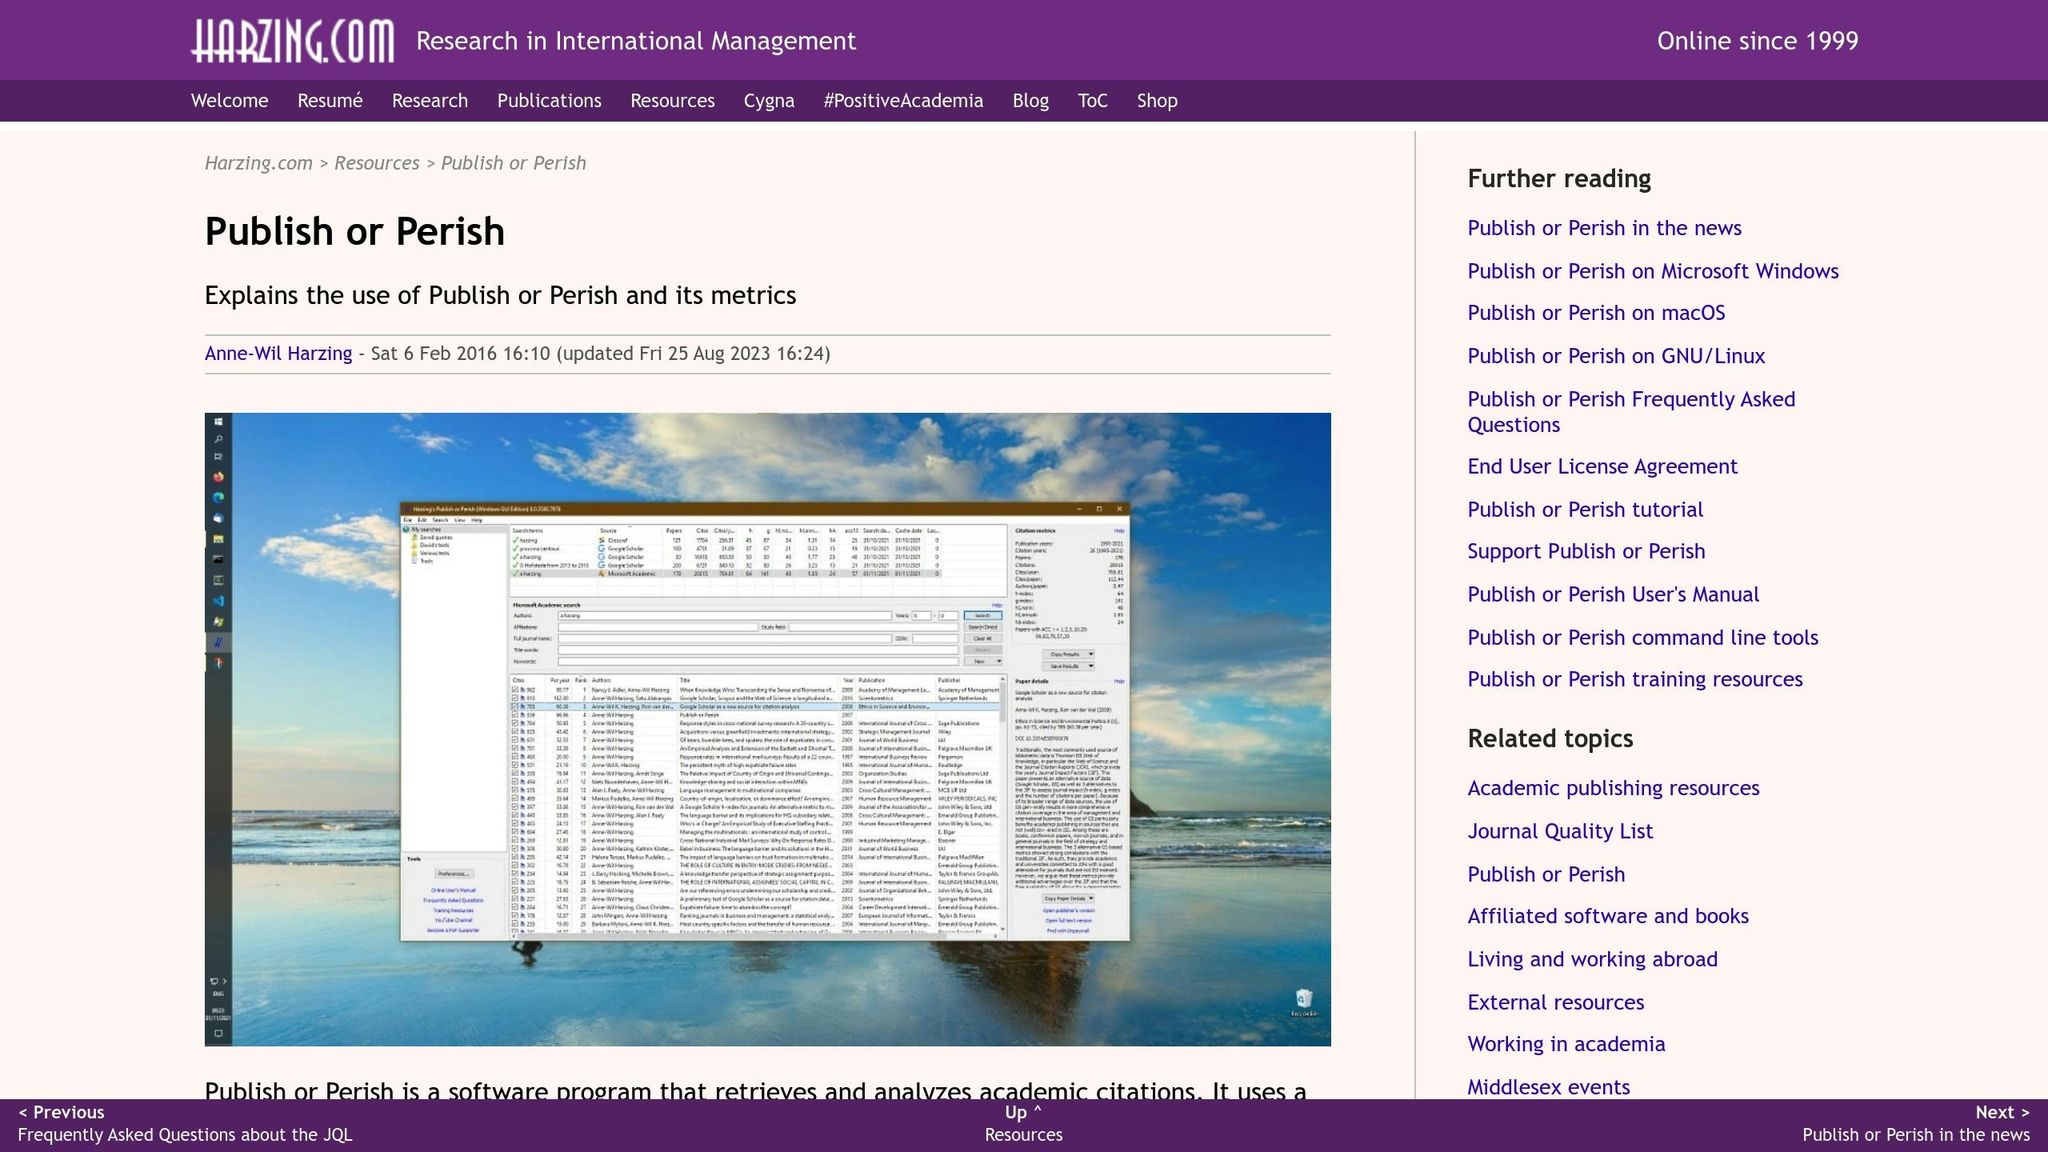
Publish or Perish (PoP) is a tool designed to help researchers analyze citations and evaluate academic impact. Created by Professor Anne-Wil Harzing, it calculates important metrics like the h-index, g-index, and contemporary h-index using data from sources like Google Scholar.
Here’s what makes Publish or Perish stand out:
- Citation Analysis: Provides detailed metrics to assess academic influence.
- Impact Metrics: Measures publications using widely recognized citation standards.
- Trend Visualization: Generates graphs and charts to illustrate citation patterns over time.
Other features include:
- Advanced search capabilities to discover clusters of related research and new topics.
- Integration with multiple databases for a broader perspective on scholarly trends.
- Customizable analytics for creating tailored metrics and visualizations.
Known for its easy-to-use interface and detailed analytics, Publish or Perish is an essential tool for bibliometric research. It pairs well with other tools that focus on visual or network-based analyses, offering a more data-driven perspective.
Conclusion
AI-powered tools have reshaped how researchers analyze trends, making it faster and easier to discover, evaluate, and visualize scholarly work. Tasks like literature reviews and citation analysis, which used to take weeks, can now be completed in minutes.
The tools we’ve discussed highlight a range of capabilities, including:
- Citation Analysis
- Visual Network Mapping
- Data Integration
- Smart Discovery Features
These advancements are opening the door to even more progress in research analysis. With AI continuing to evolve, researchers can look forward to:
- Better predictions of emerging research areas
- Improved natural language processing for deeper context understanding
- Stronger cross-disciplinary connections
- Real-time tracking of research impact
For academics navigating the vast world of publications, these tools are becoming indispensable. They not only save time but also reveal patterns and insights that might otherwise go unnoticed.
To make the most of these tools, researchers should:
- Combine Platforms: Each tool has its strengths – using a mix can provide a more thorough analysis.
- Stay Updated: Regularly explore new features and updates to maximize potential.
- Validate Data: Cross-check results across different tools to ensure accuracy.
Related Blog Posts
- SEO Optimization with AI: A Step-by-Step Prompt Guide
- How To Scape Anything With Browse.ai (Quick & Easy Guide)
- How To Automate Your Business & Marketing With AI Agents (Beginner’s Guide)
- ChatGPT vs. Perplexity vs. Grok For Research: Which One’s Better?
Put this into practice: browse business prompts and productivity prompts in the God of Prompt library — copy, paste, and run.